
Please enter CoinGecko Free Api Key to get this plugin works.
As the digital currency landscape heats up, Bitcoin’s price trajectory has been nothing short of a spectacle, shattering records and captivating investors worldwide. With a remarkable ascent, the cryptocurrency giant touched an all-time high of over $72,900, a figure that speaks volumes about its growing dominance and the feverish sentiment enveloping the market.
A Catalyst for Change: ETFs and Regulatory Shifts
The pivotal moment came with the approval of spot Bitcoin ETFs in the U.S., a game-changer that catalyzed the rally. This development, coupled with the U.K.’s Financial Conduct Authority (FCA) greenlighting crypto-backed securities, underscores a significant shift in regulatory attitudes. These movements have legitimized cryptocurrency investments and opened the floodgates for institutional money, propelling Bitcoin to new heights.
The Halving Effect: Supply Dynamics and Investor Anticipation
Central to Bitcoin’s value proposition is its halving event, a deflationary mechanism that slashes the reward for mining new blocks, thereby reducing the new supply entering the system. This event, expected to occur in mid-April, has historically been a precursor to significant price surges. Well aware of this pattern, investors are increasingly bullish, anticipating another leap in value.
Market Sentiment: Greed, Growth, and a Glimpse into the Future
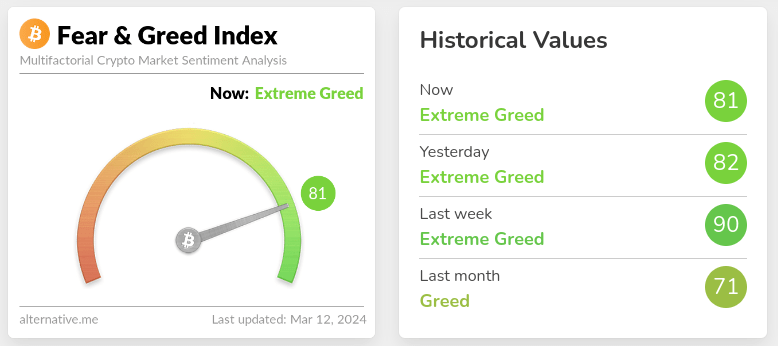
Despite the excitement, indicators like the Crypto Fear & Greed Index suggest we’re treading in “extreme greed” territory. While reflecting the bullish outlook, this sentiment also hints at the potential for volatility and corrections. Yet, CoinShares’s report of an influx of $2.6 billion into Bitcoin in a single week illustrates the unwavering confidence among investors.
The Role of Ether and the Broader Crypto Market
Please enter CoinGecko Free Api Key to get this plugin works.While Bitcoin steals the spotlight, Ether and other cryptocurrencies also make significant strides. Despite a temporary dip in investment, Ether’s year-to-date increase stands as a testament to the robust interest in blockchain technologies beyond Bitcoin. The entire crypto market, now valued at over $2.71 trillion, showcases the immense growth and diversification of digital assets.
Looking Ahead: Volatility, Valuation, and the Vestiges of Growth
Bitcoin’s journey is emblematic of the broader cryptocurrency market’s volatility and vigor. With every halving event, regulatory announcement, and institutional endorsement, the landscape shifts, presenting both opportunities and challenges. As the market matures, the interplay between supply dynamics, investor sentiment, and regulatory frameworks will continue to shape the future of digital finance.
Navigating Uncertainty: Insights from Experts and the Path Forward
Despite the euphoria, caution remains a watchword. Analysts and experts emphasize the speculative nature of cryptocurrencies and the potential for rapid changes in valuation. Yet, the consensus suggests that the underlying fundamentals of Bitcoin and the broader crypto market are strong, driven by technological advancements, increasing acceptance, and the continuous influx of institutional investments.
Conclusion: Bitcoin’s Resilience and the Dawn of a New Era
Bitcoin’s latest record-breaking rally is more than a fleeting moment; it’s a harbinger of the digital currency’s resilience and the growing acceptance of cryptocurrencies as a legitimate component of the global financial system. As we stand at the precipice of this new era, the journey of Bitcoin and its counterparts is far from over. With each milestone, the crypto market cements its place in the financial landscape, promising a future where digital currencies play a pivotal role.
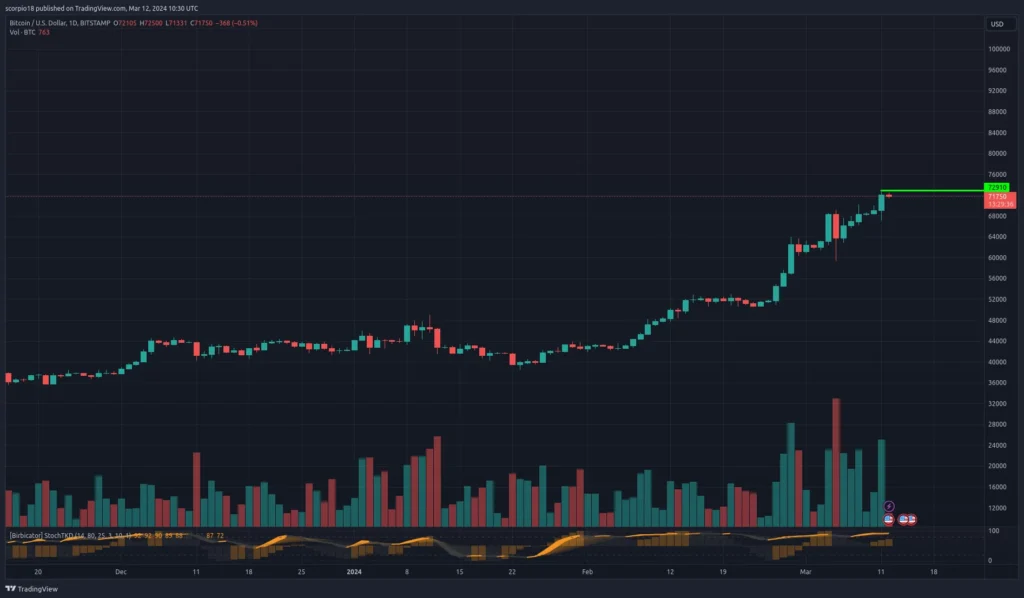
Short Bitcoin Market Analysis
The chart appears to show a series of candles indicating price action over a period of time. With the inclusion of volume bars and what seems to be an indicator at the bottom (likely a stochastic oscillator), we can extract valuable insights.
Firstly, the price action is in a clear uptrend, marked by a series of higher highs and higher lows. This is bullish, and it’s supported by increasing volume, particularly on green (up) candles, which suggest strong buying interest.
The stochastic oscillator at the bottom, typically oscillating between 0 to 100, is used to identify overbought or oversold conditions. The marked points at ’87’ and ’72’ on the scale could indicate potential overbought situations where the market could expect a retracement or consolidation. However, it’s difficult to conclude definitively without seeing the specific level (usually above 80 for overbought).
The current candle on the chart shows a slight pullback from the previous candle, but without more context or additional technical indicators, it’s not enough to predict a trend reversal.
Notably, there’s a horizontal line near the chart’s top, possibly indicating resistance. If the price action breaks above this line with significant volume, it could signal a continuation of the bullish trend.
Without specific questions or instructions on what to focus on, this general analysis covers the key visible elements.
Disclaimer: The information provided is not trading advice. CryptoNetCap News holds no liability for any investments made based on the information provided on this page. We strongly recommend independent research and/or consultation with a qualified professional before making any investment decisions.